
Rotura confirmada en el gráfico de 1 Hora de Microsoft Corporation
Esta configuración de trading en Microsoft Corporation está formada por un período de consolidación; un período en el que el precio se mueve principalmente de forma lateral antes de elegir una nueva dirección a largo plazo. Debido a la rotura bajista a través del nivel de soporte, parece sugerir que podríamos ver el próximo movimiento […]
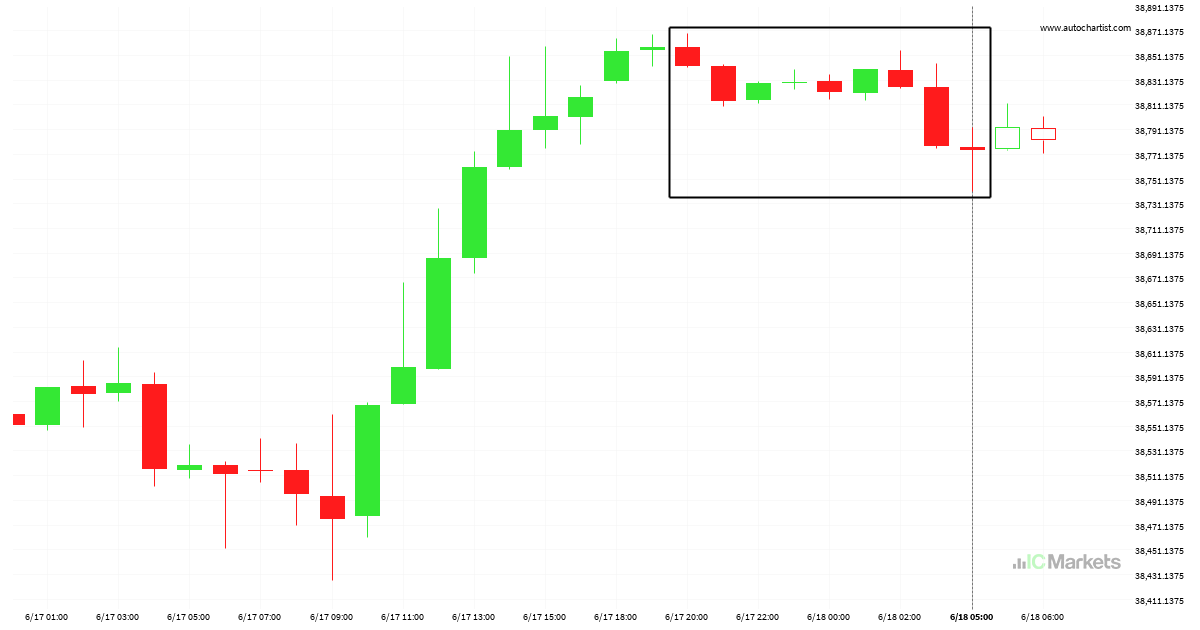
Oportunidad rara en US Wall Street 30 Index – movimiento bearish extremo
Aquellos de ustedes que sean seguidores de tendencias probablemente estarán observando ansiosamente US Wall Street 30 Index para comprobar si el último movimiento de un 0,26% continúa. Si no lo hace, las personas fieles al método de reversión a la media estarán encantadas con este excepcionalmente gran movimiento de 9 horas.
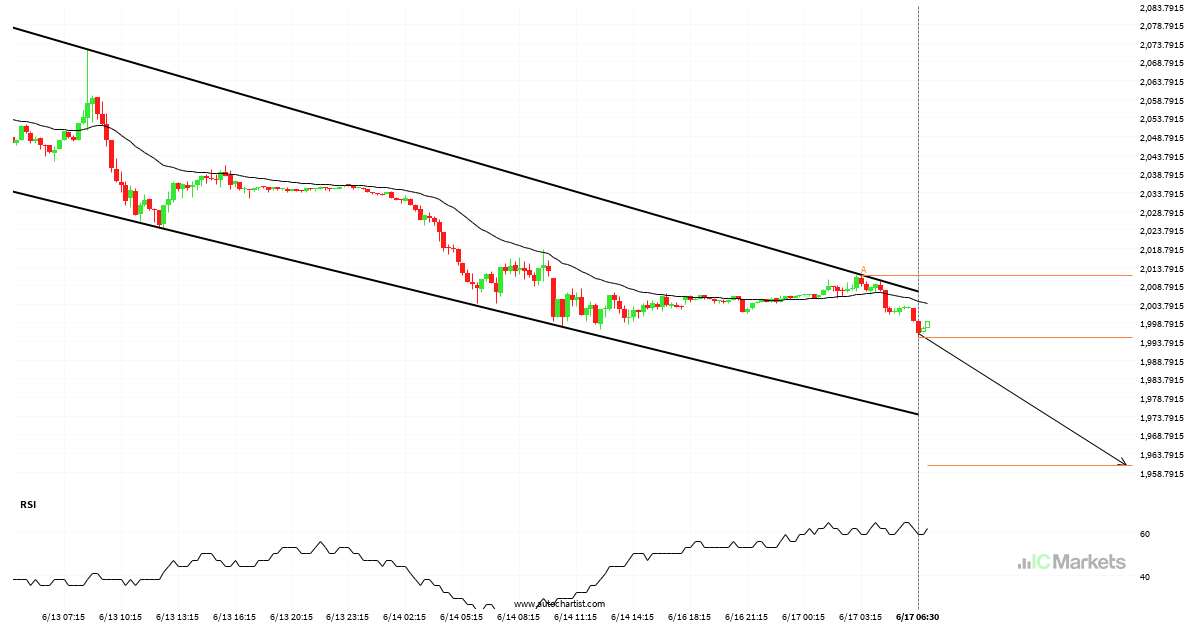
¿Deberíamos esperar una ruptura o una recuperación del US Small Cap 2000 Index?
El US Small Cap 2000 Index se dirige a la línea de soporte de un Canal bajista. Si este movimiento se mantiene, el precio de US Small Cap 2000 Index podría probar el nivel de 1960.6762 en las próximas 14 horas. Ya ha probado esta línea en numerosas ocasiones, por lo que este movimiento podría […]
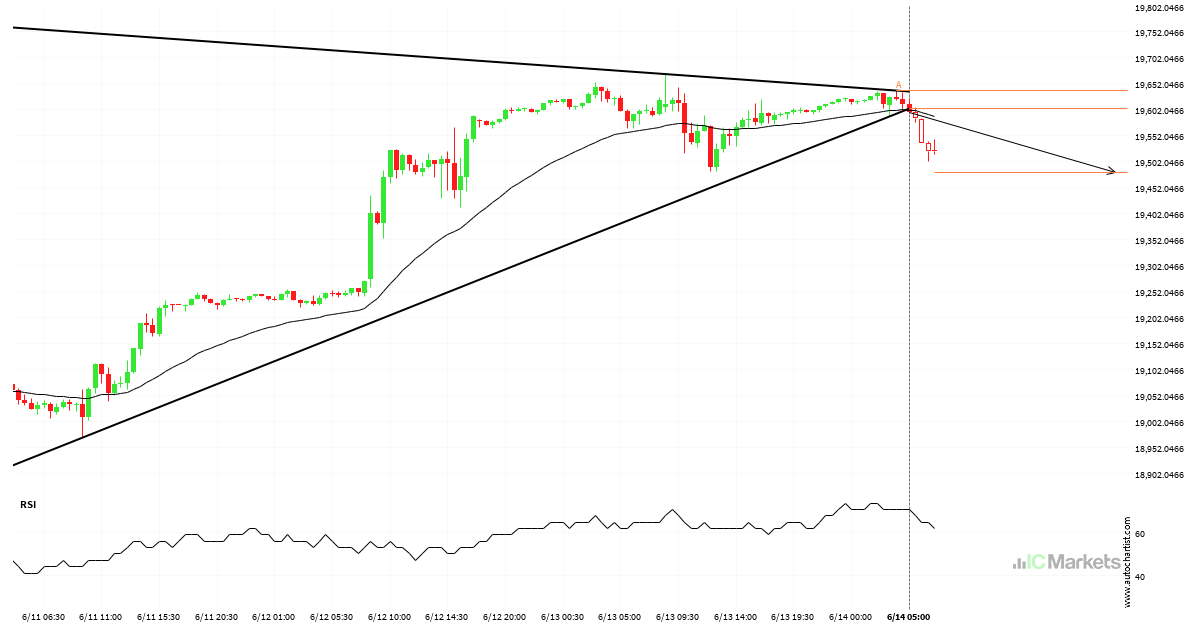
Previsión de trading de US Tech 100 Index a las 2024-06-14T10:30:00.000Z hasta las 2024-06-14T10:30:00.000Z
El US Tech 100 Index ha atravesado la línea de soporte de un patrón de gráfico técnico con un Triángulo. Como le hemos visto retroceder desde esta posición en el pasado, deberíamos esperar la confirmación de la ruptura antes de actuar. Ha llegado a esta línea dos veces en los últimos 4 días y sugiere […]
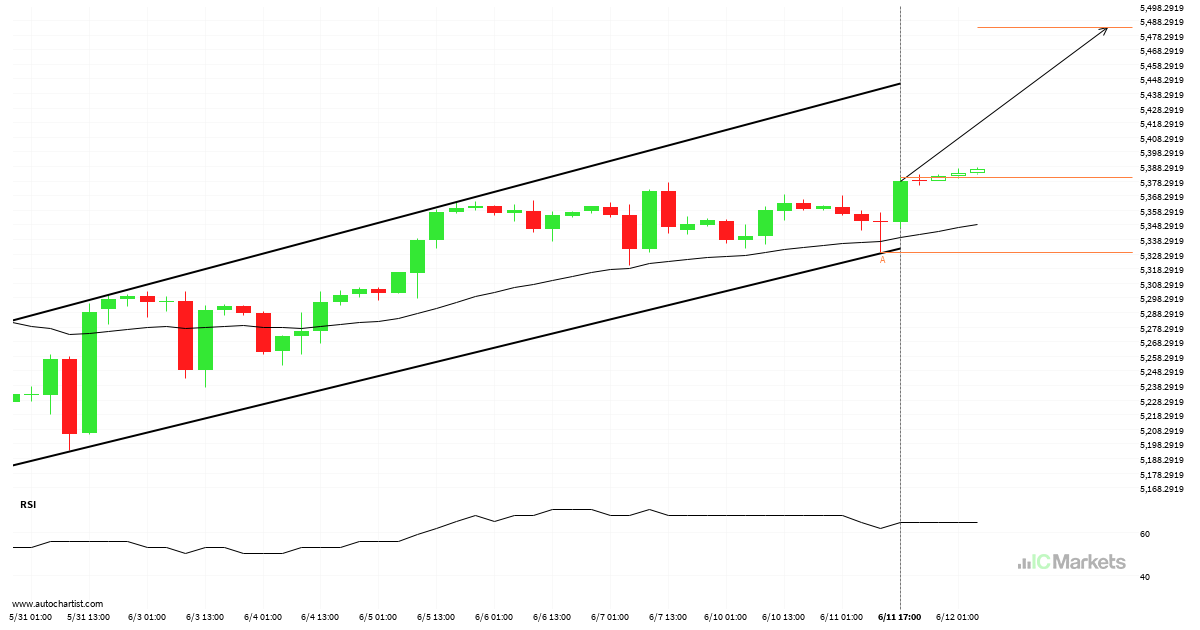
US SPX 500 Index – Reversal Patrón de gráfico – Canal alcista
El movimiento del US SPX 500 Index hacia la línea de resistencia de un Canal alcista es otra prueba más de la línea que ha alcanzado en numerosas ocasiones durante el pasado. Esta prueba de la línea podría ocurrir en las próximas 2 días, pero no sabemos si dará como resultado una ruptura a través […]
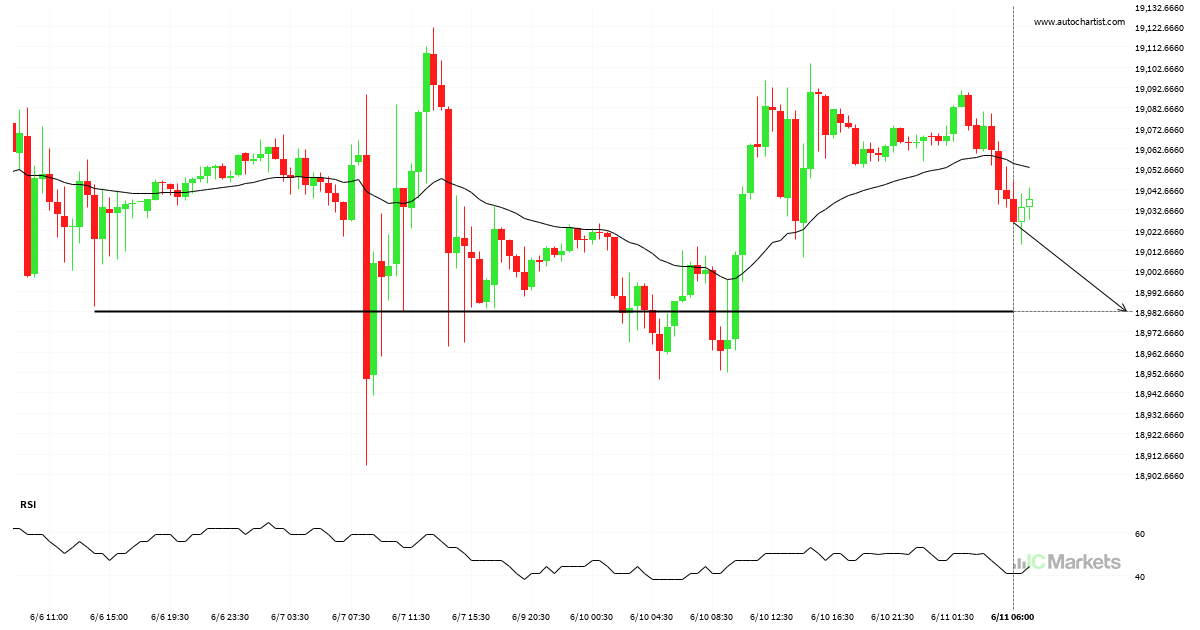
O bien, una inminente recuperación o una ruptura del US Tech 100 Index
Se identificó un fuerte nivel de soporte en 18982.5605 en el gráfico de 30 Minutos de US Tech 100 Index. Es probable que US Tech 100 Index lo testee pronto.

US SPX 500 Index – línea de precio psicológico atravesada
US SPX 500 Index ha roto la línea de soporte en 5342.0498. Puede continuar la tendencia bajista hacia 5324.4150 o puede resultar ser otro testeo más de este nivel.
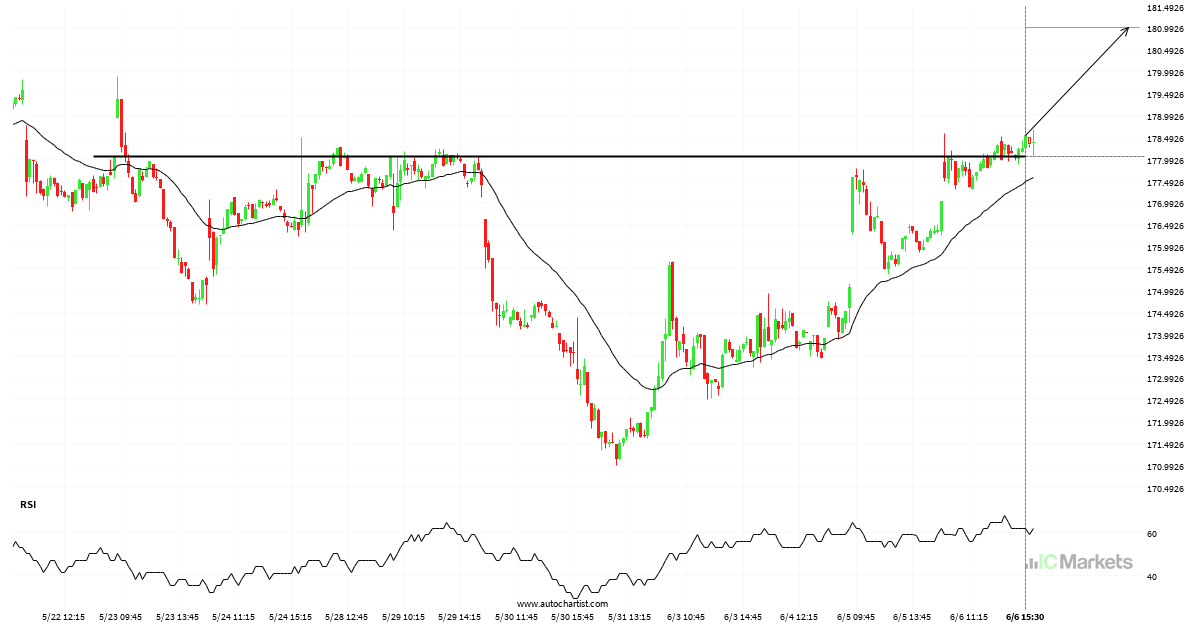
Importante línea de precio atravesada por el ALPHABET INC CLASS C
El ALPHABET INC CLASS C atravesó la línea de resistencia. Como ya lo hemos visto retroceder desde esta posición en el pasado, deberíamos esperar la confirmación de la ruptura antes de operar. Ha llegado a esta línea en numerosas ocasiones en los últimos 16 días, lo cual sugiere un posible nivel objetivo alrededor de 180.9930 […]
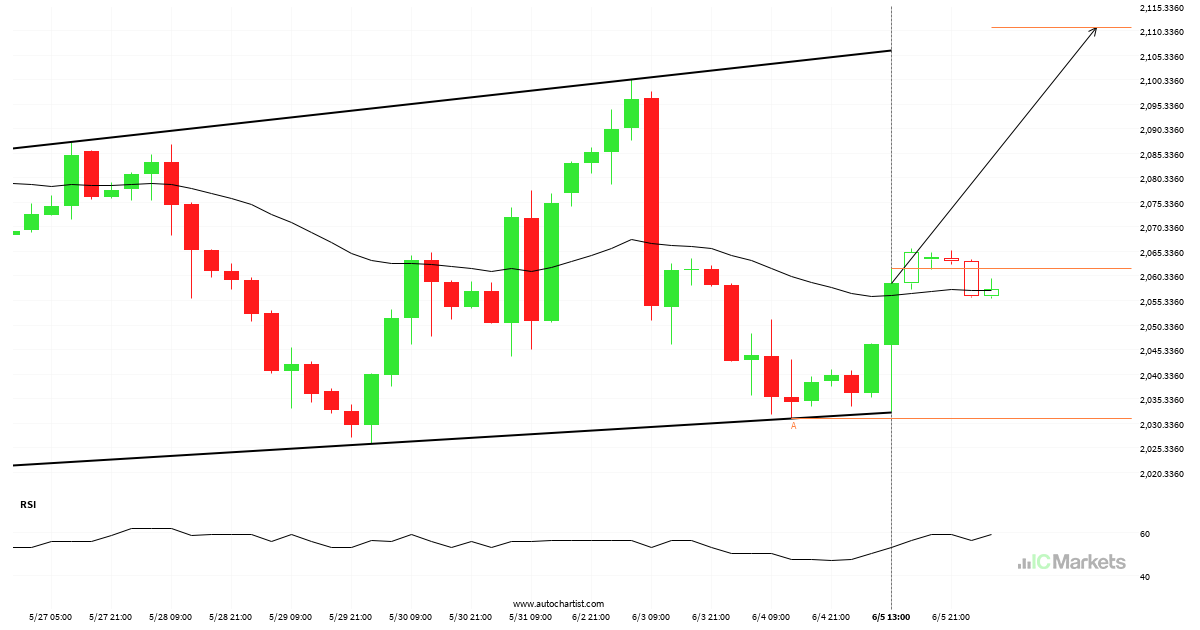
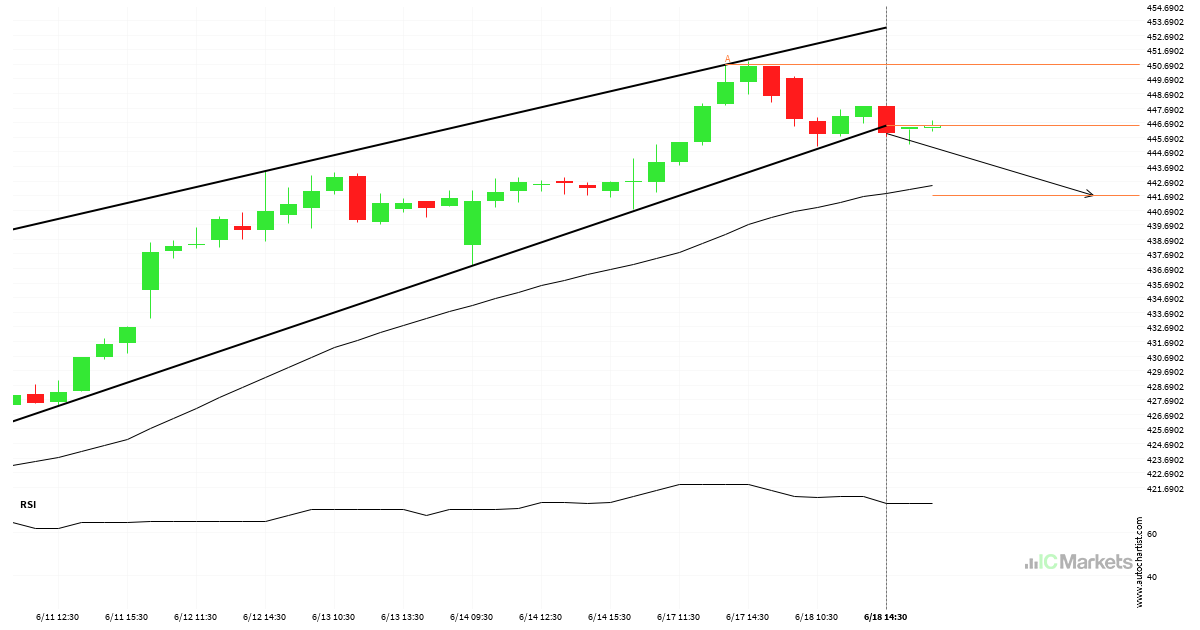
¿Deberíamos esperar una ruptura o una recuperación del US Small Cap 2000 Index?
El US Small Cap 2000 Index avanza hacia una línea de resistencia. Como le hemos visto retroceder desde esta línea anteriormente, podríamos presenciar, o bien, una ruptura a través de esta línea o una recuperación a los niveles actuales. Ha llegado a esta línea en numerosas ocasiones en los últimos 14 días y puede probarla […]

Rotura confirmada en el gráfico de 1 Hora de US Tech 100 Index
Se ha atravesado un fuerte nivel de resistencia en 18716.2695 en el gráfico de 1 Hora de US Tech 100 Index. La teoría del análisis técnico pronostica un movimiento a 18959.7578 en el próximo período de 3 días.